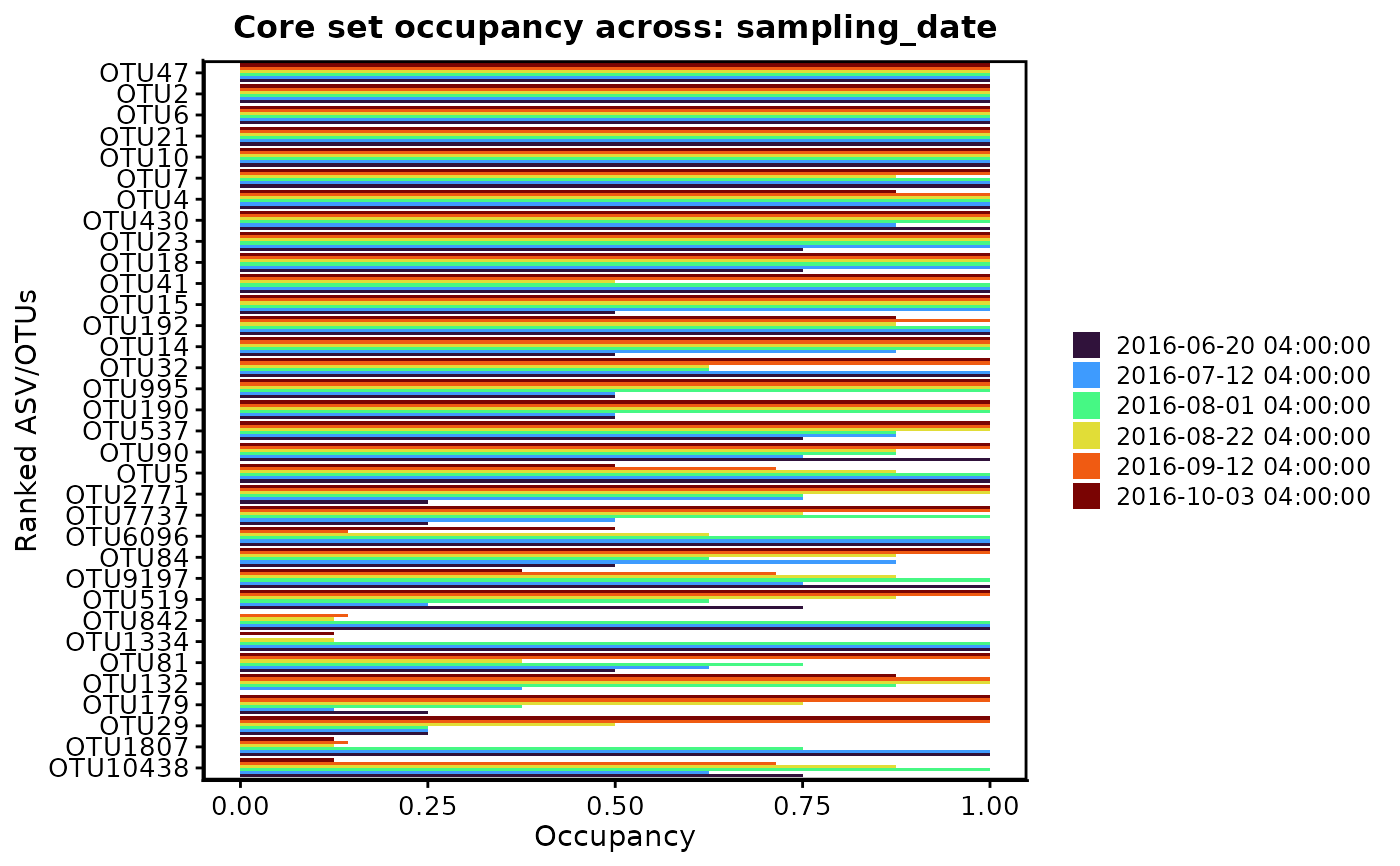
Plot Core Taxa Occupancy Across Metadata Groups
Source:R/plot_core_distribution.R
plot_core_distribution.RdCreates a plot showing core taxa (i.e. OTUs/ASVs) occupancy patterns across a grouping variable.
Usage
plot_core_distribution(
  core_result,
  core_set = "elbow",
  group_var = "Crop",
  plot_type = c("bar", "line", "heatmap")
)
Arguments
- core_result
A list object returned by
identify_core, containing at minimum:otu_table: A data frame with ASV/OTUs as rows and samples as columns.metadata: A data frame with samples as rows and grouping variables as columns.otu_ranked: A data frame with ranked taxa containing:otu: A column with taxa names.rank: A column with the rank for each taxon.
elbow_core: Character vector of OTU IDs identified as core using the elbow method.increase_core: Character vector of OTU IDs identified as core using the increase method.
- core_set
Which core set to plot: "elbow" (default) or "increase".
- group_var
Metadata column for bar coloring. Default: "sampling_date".
- plot_type
Allows selection of 3 different plot types:
bar,line, orheatmap.